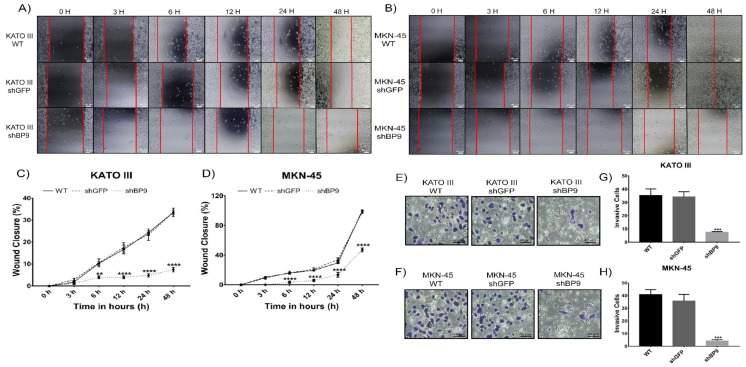
Figure 5.
Effect of knocking down TASK-3 on cell migration and invasion in KATO III and MKN-45 cells. (A,B) Wound healing assays: images obtained at 0, 3, 6, 12, 24, and 48 h after scratch formation. (C,D) Percentage of wound closure for both cell lines in each condition. Scale bar 40 µm. (E,F) Transwell invasion assays: representative images obtained for KATO III and MKN-45 wild-type (WT), or cells transduced with shGFP (control) and shBP9 (experimental) cells. Scale bar 40 µm. (G−H) The number of invasive cells for both cell lines in each condition. Data are shown as mean ± SEM of three independent experiments. Wound closure percentage was assessed by ANOVA followed by Tukey’s post-test. ** p < 0.01, **** p < 0.0001. Cell invasion was evaluated by ANOVA followed by Dunnett’s test. *** p < 0.001, compared to WT.

