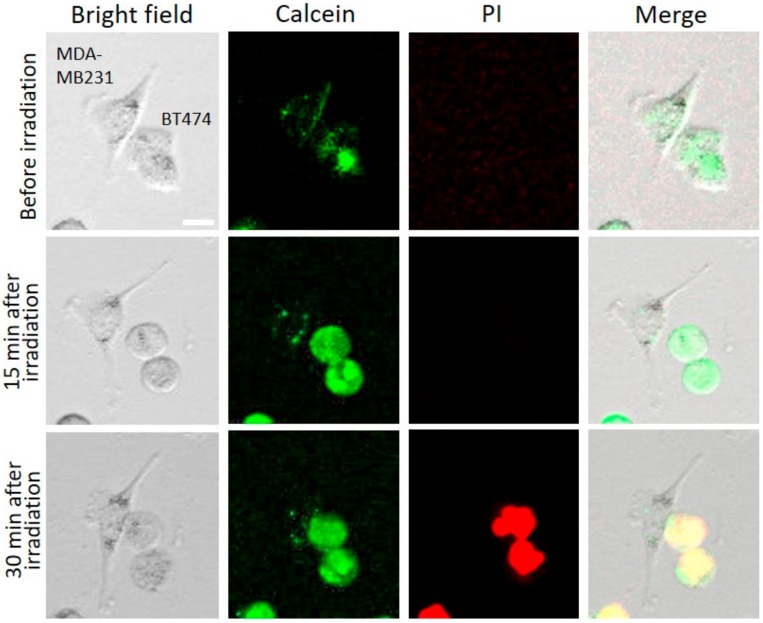
Figure 9.
Cell images of calcein and propidium iodide (PI) analysis before NIR irradiation, 15 min after NIR irradiation, and 30 min after NIR light irradiation. HER2-overexpressing cells (BT474) and HER2 low-expressing cells (MDA-MB231) were stained by calcein before NIR light irradiation. While BT474 cells were swelling, green fluorescent remained intracellular. The BT474 cells that got big cell membrane damage due to bursting were stained by PI, whereas MDA-MB231 were intact. Scale Bar: 20 µm.

