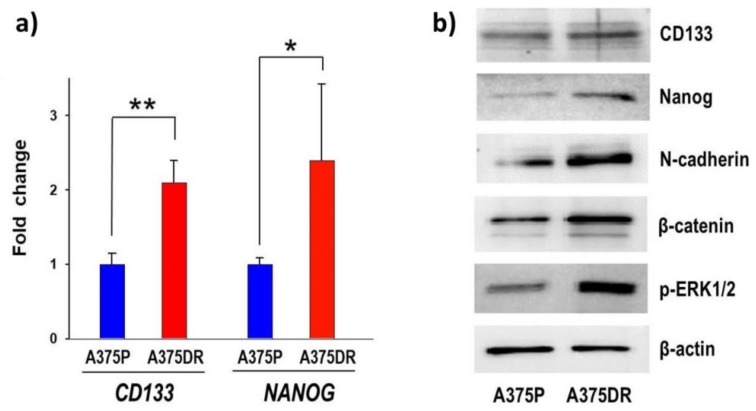
Figure 4.
Expression levels of malignancy markers on A375DR versus A375P cells. (a) mRNA expression levels of CD133 and NANOG. Values were measured with RT-qPCR in ONC-free A375P (blue bars) and A375DR (red bars) cells, respectively. Average data ± S.D. refer to three independent experiments, each performed in triplicate; * p < 0.05, ** p < 0.01; and (b) representative WB showing the expression levels of CD133, NANOG, N-cadherin, nuclear β-catenin, p-ERK1/2, and β-actin (the latter for normalization) relative to the two ONC-free A375 cell subpopulations.

