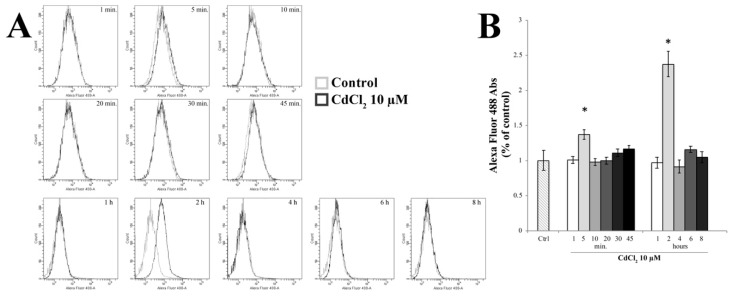
Figure 4.
Evaluation of reactive oxygen species (ROS) generation. (A) Time-course (1–8 h) of ROS production by H2DCFDA fluorescence in control and in 10 µM Cd-treated RBE4 cells by fluorescence-activated cell sorting (FACS) analysis. (B) The reported values are expressed as mean ± S.E.M., n = 9. Control condition was arbitrarily set at 100%; * p < 0.05 vs. control (untreated cells).

