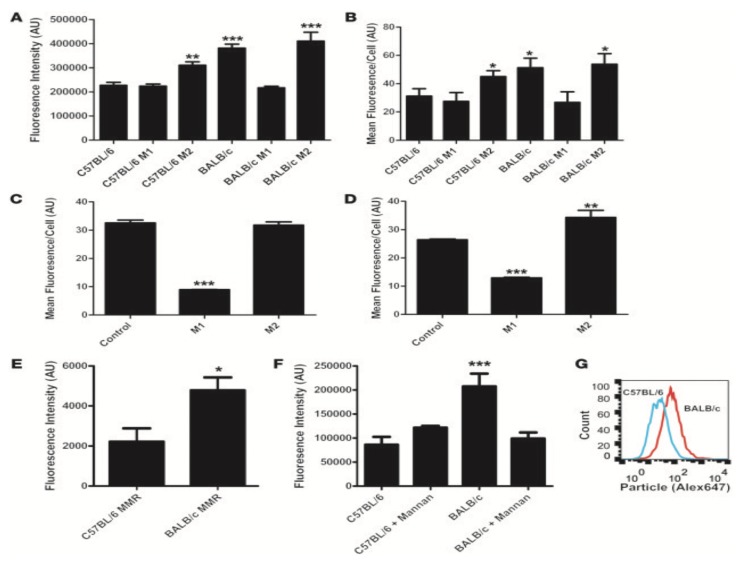
Figure 7.
(A) Average integrated fluorescence per cell showed a significant (p < 0.0001, 1-way ANOVA with Dunnett’s post test) increase in particle uptake by BALB/c untreated, BALB/c Th2-treated, and C57BL/6 Th2-treated versus C57BL/6 untreated cells. C57BL/6 M1-treated cells showed no significant difference compared with C57BL/6 untreated cells (n = 4). (B) Flow cytometric analysis of uptake showed a significant (p < 0.05, 1-way ANOVA with Dunnett’s post test) increase in uptake by BALB/c untreated, BALB/c Th2-treated, and C57BL/6 Th2-treated versus C57BL/6 untreated cells. C57BL/6 M1-treated and BALB/c M1-treated cells showed no significant difference compared with C57BL/6 untreated cells (n = 4). (C) Flow cytometric analysis of uptake by human macrophages from volunteer A. M1 macrophages took up significantly fewer particles than control or M2 macrophages (n = 4) (p < 0.0001, 1-way ANOVA with Dunnett’s post test). (D) Flow cytometric analysis of uptake by human macrophages from volunteer B. M1 macrophages took up significantly fewer particles than the control macrophages (p < 0.0001, 1-way ANOVA with Dunnett’s post test). M2 macrophages took up significantly more particles than the control macrophages (n = 4) (p < 0.001, 1-way ANOVA with Dunnett’s post test). (E) Flow cytometric analysis of surface MMR expression on Balb/c and C57BL/6 mice. Balb/c mice showed significantly higher surface expression of MMR (n = 4) (p < 0.05, unpaired 2-tailed t test). (F) Microscopic analysis of uptake by BMMs after mannan blocking. The addition of mannan reduced uptake by Balb/c macrophages to the same levels as those of the C57BL/6 controls (n = 4) (p < 0.0001, 1-way ANOVA with Dunnett’s post test). (G) Representative flow cytometric histogram of particle uptake by BALB/c and C57BL/6 BMMs.

