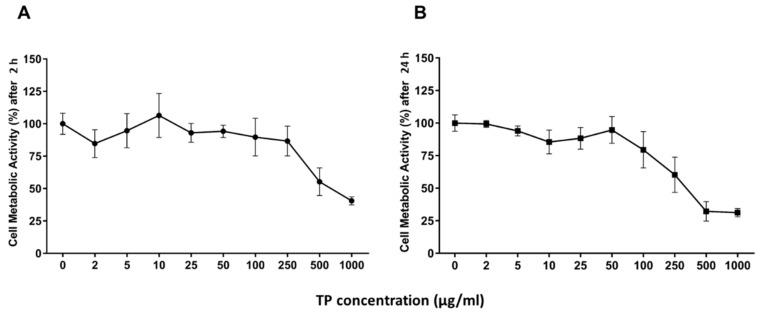
Figure 2.
Dose- and time-dependent cell metabolic activity. HUVECs were cultured for 2 h (A) and 24 h (B) in the presence of different concentrations of TPs from OLE. Cell metabolic activity was determined by WST-1 colorimetric assay and expressed as metabolic activity percentage compared to control (untreated cells). Graphical data are represented as mean ± SD of three separate experiments run in triplicate.

