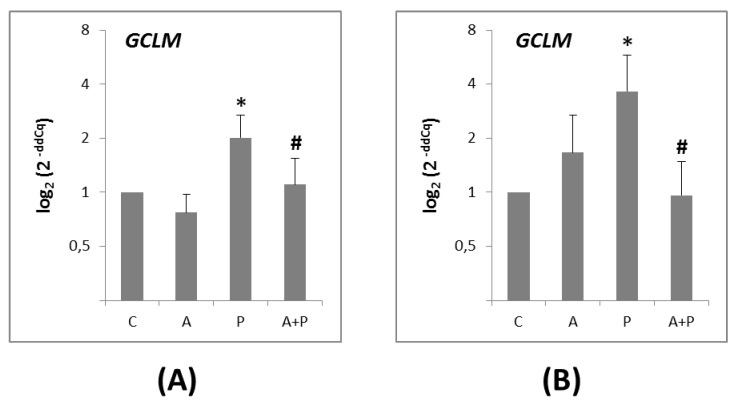
Figure 4.
(A) Expression levels of GCLM gene in CC of COC cultured without the addition of drugs (control, C), treated with GnRHa (A), phosphoramide mustard (P), and GnRHa+phosphoramide mustard (A+P); (B) Expression levels of GCLM gene in oocytes of COC cultured without the addition of drugs (control, C), treated with GnRHa (A), phosphoramide mustard (P), and GnRHa+phosphoramide mustard (A+P). Results are expressed as log2 (2-ddCq) values using HPRT1 as reference gene and C group as calibrator. Error bars denote standard error. *: p value < 0.05 in A group versus P group; #: p value < 0.05 in P group versus AP group.

