Figure 1.
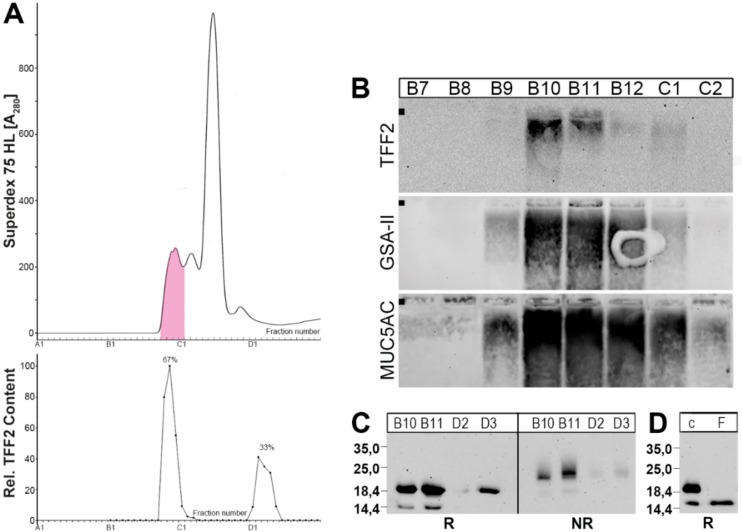
Analysis of human gastric extract (MC-577). (A) Elution profile after SEC on a Superdex 75 HL column as determined by absorbance at 280 nm (PAS-positive mucin fractions: pink). Underneath: Distribution of the relative trefoil factor family 2 (TFF2) content as determined by Western blot analysis under reducing conditions and semi-quantitative analysis of the typical 20 k-band intensities. (B) 1% agarose gel electrophoresis (AgGE) and subsequent Western blot analysis of the fractions B7-C2 concerning TFF2, MUC6 (lectin GSA-II), and MUC5AC, respectively. The start is marked with a dot on the left. (C) Fifteen percent SDS-PAGE and subsequent Western blot analysis of fractions B10/B11 and D2/D3 concerning TFF2 (R, NR: reducing and non-reducing conditions, respectively). The molecular mass standard is indicated left. (D) Digestion of fraction B12 with PNGase F and Western blot analysis concerning TFF2 (15% SDS-PAGE, reducing conditions); c, undigested control; F, sample digested with PNGase F.

