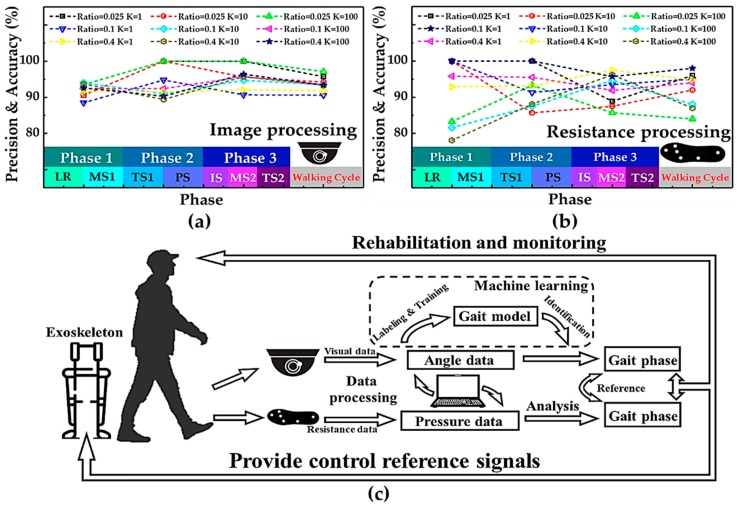
Figure 11.
Comparison and combination of the pressure-sensitive insole and visual system. (a) The accuracy of visual data recognition in each phase of gait in machine learning varies with the change of parameters in the k-nearest neighbor (kNN) method. (b) The accuracy of resistive pressure data recognition in each phase of gait in machine learning varies with the change of parameters in the kNN method. (c) Schematic diagram of plantar pressure distribution and gait division analysis system with visual aid system.

