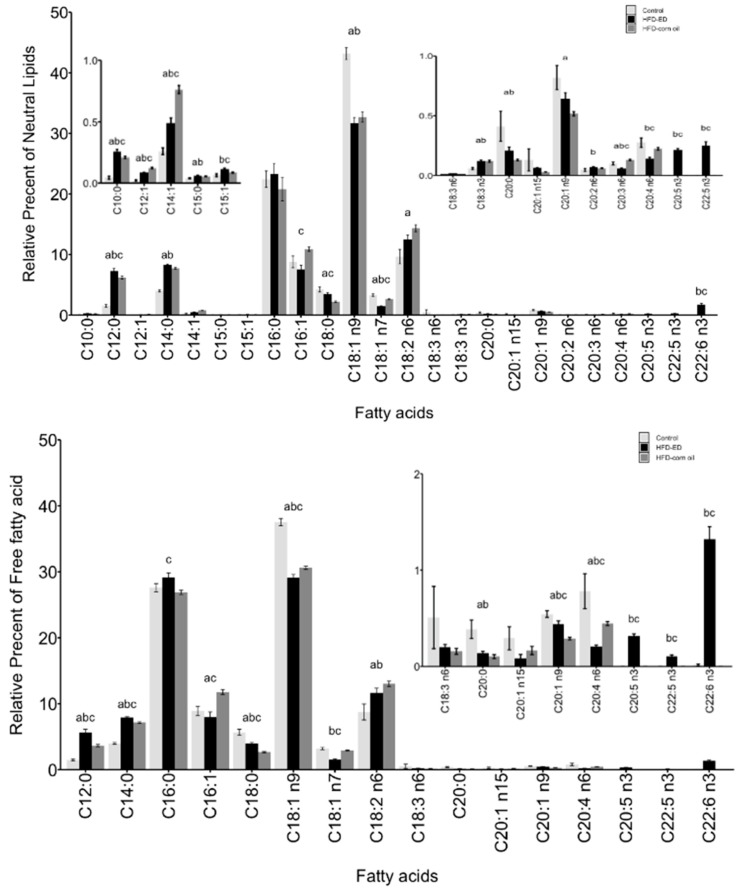
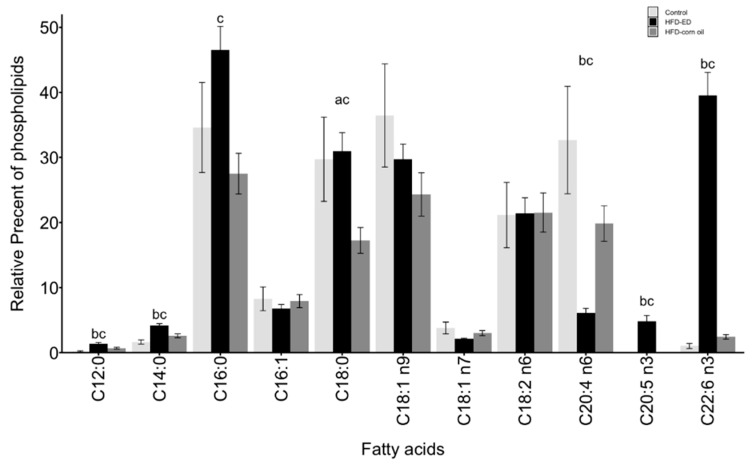
Figure 2.
BAT.Fatty acids methyl esters (FAME) composition is shown as mean ± SEM and as a relative percentage of total lipid fractions in order of increasing number of carbon-chain length of respective fatty acid. n3 and n6 denotes omega-3 and omega-6 fatty acids, respectively. White bar control, black bar HFD-ED, grey bar HFD-corn oil (top) BAT neutral lipid fraction and FAME composition, (middle) BAT free fatty acid fraction and FAME composition, (bottom) BAT phospholipid fraction and FAME composition, from the mice fed either control diet (BAT n = 5), HFD-ED (BAT n = 8) or HFD-corn oil (BAT n = 12) after 8-week dietary intervention. The significance is denoted by different letters and the statistical difference was tested by ANOVA followed by Tukey’s multiple comparison test where letter a = p-value < 0.05 between HFD-corn oil vs. control diet; b = p-value < 0.05 between HFD-ED vs. control diet; c = p-value < 0.05 between HFD-ED vs. HFD-corn oil.


