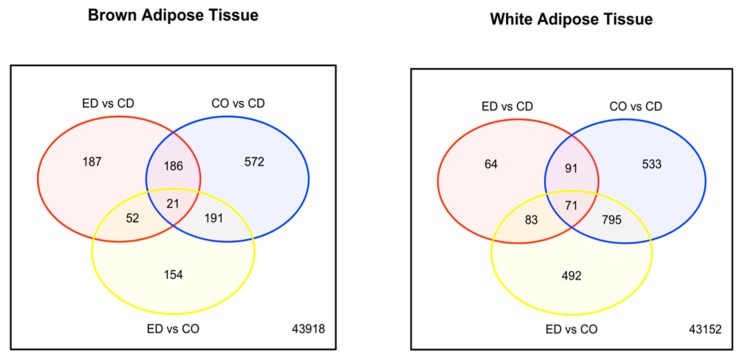
Figure 4.
Venn diagram of differentially regulated genes at the cut off of the p-value < 0.001 after 8-week dietary intervention. (Left) Venn diagram depicting overlaps among differentially expressed genes in BAT upon dietary intervention. Most regulation can be seen for comparison HFD-corn oil vs. control diet (CO vs. CD) = blue and HFD-ED vs. HFD-corn oil (ED vs. CO) = yellow, whereas HFD-ED vs. control diet (ED vs. CD) = red shows comparatively less bidirectional differentially regulated genes. (Right) Venn diagram depicting overlaps among differentially expressed genes in WAT upon dietary intervention. Most regulation can be seen for comparison HFD-corn oil vs. control diet (CO vs. CD) and HFD-ED vs. HFD-corn oil (ED vs. CO), whereas HFD-ED vs. control diet (ED vs. CD) shows least bidirectional differentially regulated genes.

