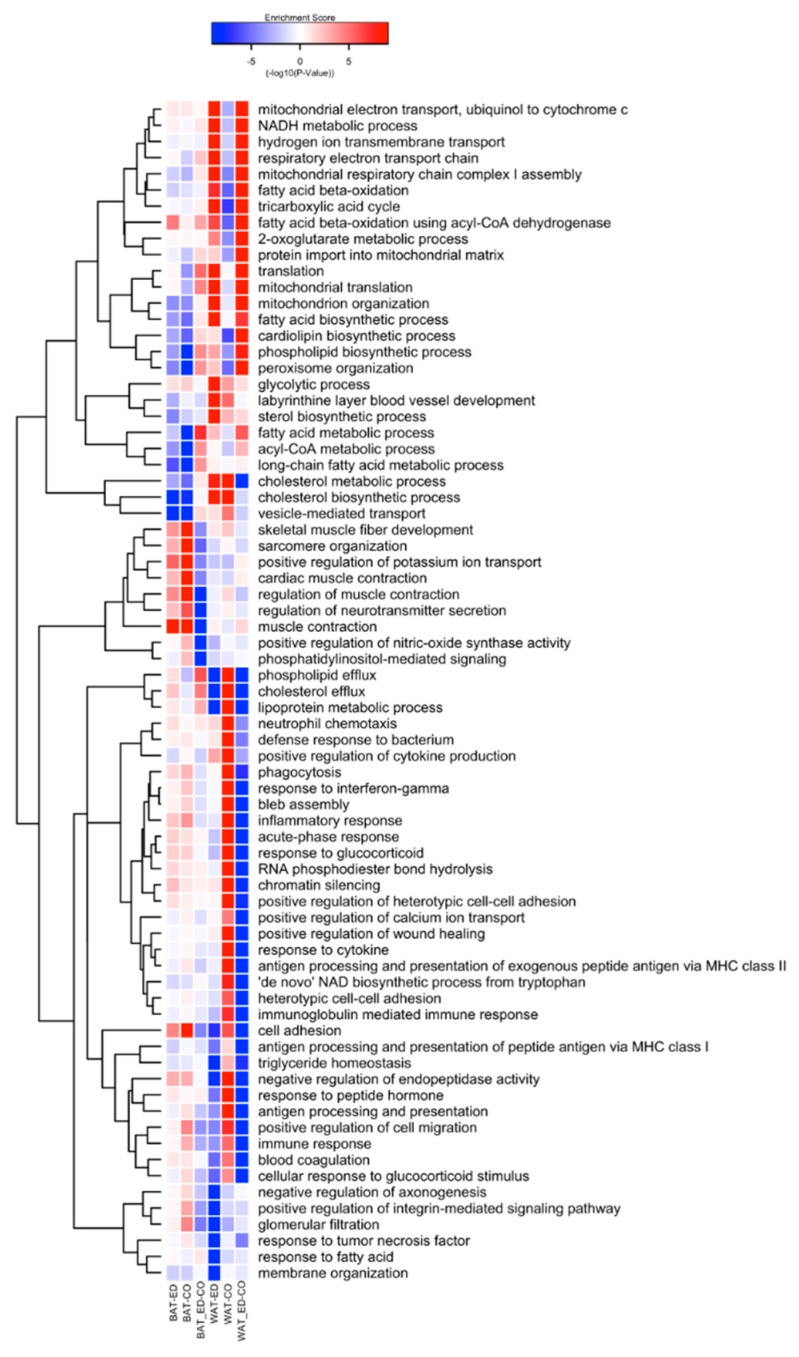
Figure 6.
A heatmap showing significant biological process (BP) GO-terms (p-value < 10−10) for different diet across BAT and WAT after 8 weeks diet intervention. Colour patterns indicate the direction of regulation where red indicates up-regulation and blue indicates down-regulation of immune specific GO-terms. Labels, HFD-ED = HFD-ED vs. control diet; HFD-CO = HFD-corn oil vs. control diet; ED-CO = HFD-ED vs. HFD-corn oil.

