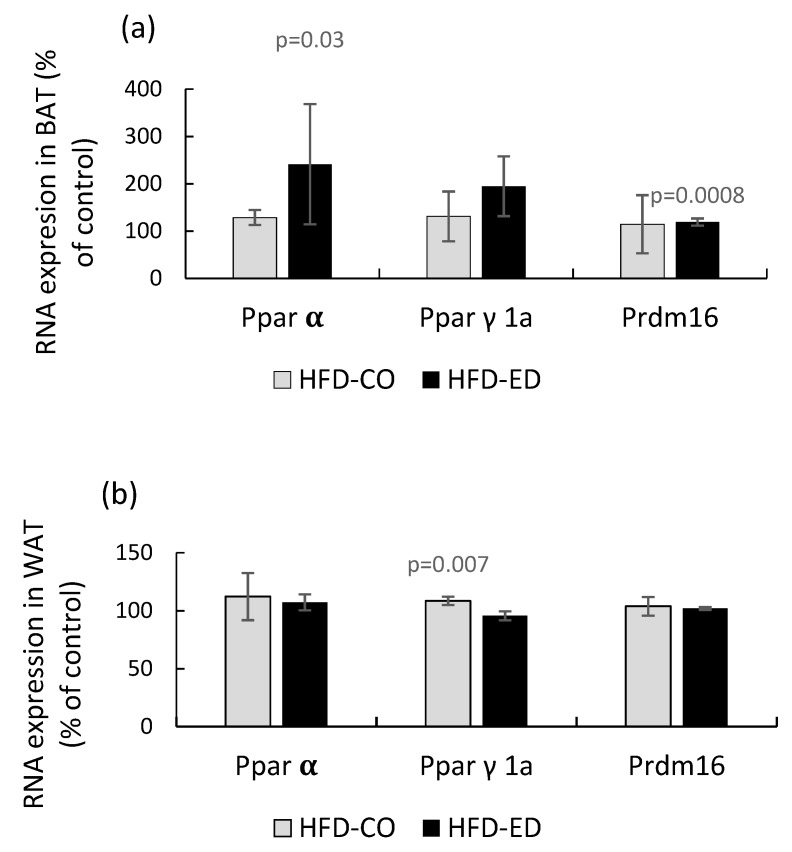
Figure 7.
RNA expression of Pparα, Pparγ1a and Prdm16 in (a) BAT and (b) WAT in response to HFD-ED and HFD-CO relative to the control diet. All data for BAT are mean values of 3 tissues (n = 3). WAT RNA expression in the HFD-ED group was based on 2 animals due to that the RNA from the third animal did not pass the quality check. Also data on Prdm16 in the WAT control diet group was based on n = 2 (missing value).

