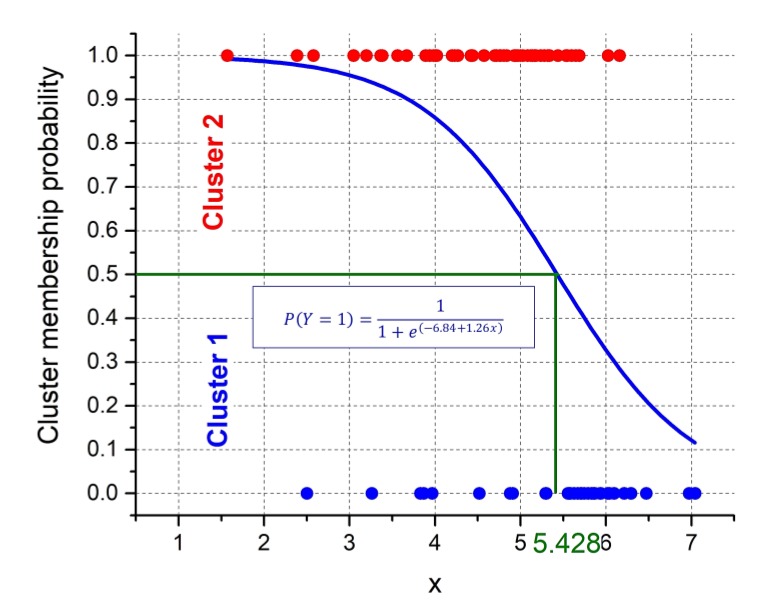
Figure 9.
Cluster membership (blue dots = Cluster 1 and red dots = Cluster 2) obtained by the divisive analysis (DIANA) clustering compared with the probabilities predicted by the logistic regression (blue curve obtained by Equation (4)). Probabilities p ≤ 0.5 and p > 0.5 correspond to Cluster 1 and 2, respectively. The threshold for the “non-acoustic” parameter x to discriminate between the cluster membership is reported in green.

