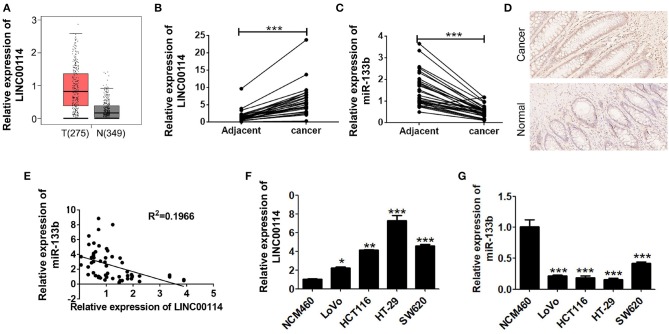
Figure 1.
LINC00114 is upregulated in CRC. (A) Highly expressed LINC00114 is predicted in the GEPIA database. (B) LINC00114 is upregulated in the CRC samples compared to the adjacent normal tissue samples, determined via RT-PCR assay. (C) RT-PCR result shows that expression of miR-133b expression is reduced in the CRC samples. (D) LINC00114 expression is higher in the CRC as measured by in situ hybridization (200X). (E) There is an inverse correlation between LINC00114 and miR-133b expression in the CRC tissue samples. (F,G) The expression levels of LINC00114 and miR-133b in the CRC cells are determined by RT-PCR. *P < 0.05; **P < 0.01; ***P < 0.001.

