Figure 2.
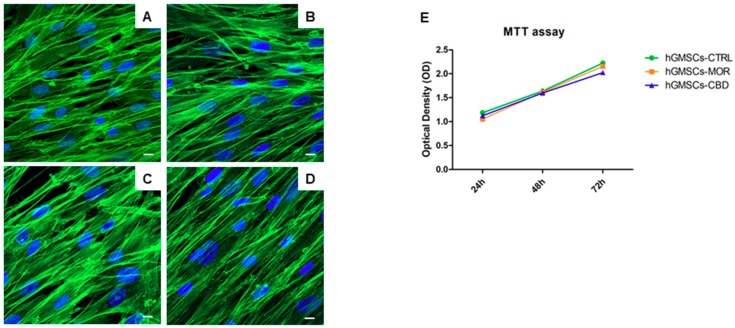
The immunofluorescence analysis for actin expression showed no morphological changes in hGMSCs-MOR (B) and in hGMSCs-CBD (D) when compared to hGMSCs-CTRL (A,C). Green fluorescence: cytoskeleton actin. Blue fluorescence: cell nuclei. Mag: 63X. Scale bar: 5 µm. The hGMSCs treated with MOR or CBD showed a similar proliferation rate of the untreated cells as demonstrated by MTT assay at 24, 48 and 72 h of culture (E).

