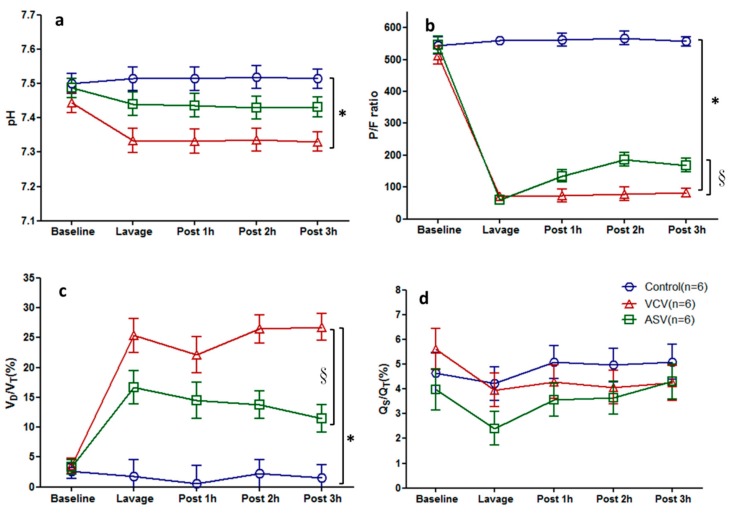
Figure 2.
Time course of gas exchange in the three experimental groups (n = 6 in each group). (a) pH, (b) P/F ratio, (c) dead space (VD/VT ratio =(PaCO2-PetCO2)/PaCO2), (d) pulmonary shunt fractions (Qs/Qt = (CcO2 − CaO2)/CcO2 − CvO2)). The data are presented as the mean ± SD. * p < 0.05 compared with the control group; § p < 0.05 compared with the VCV group.

