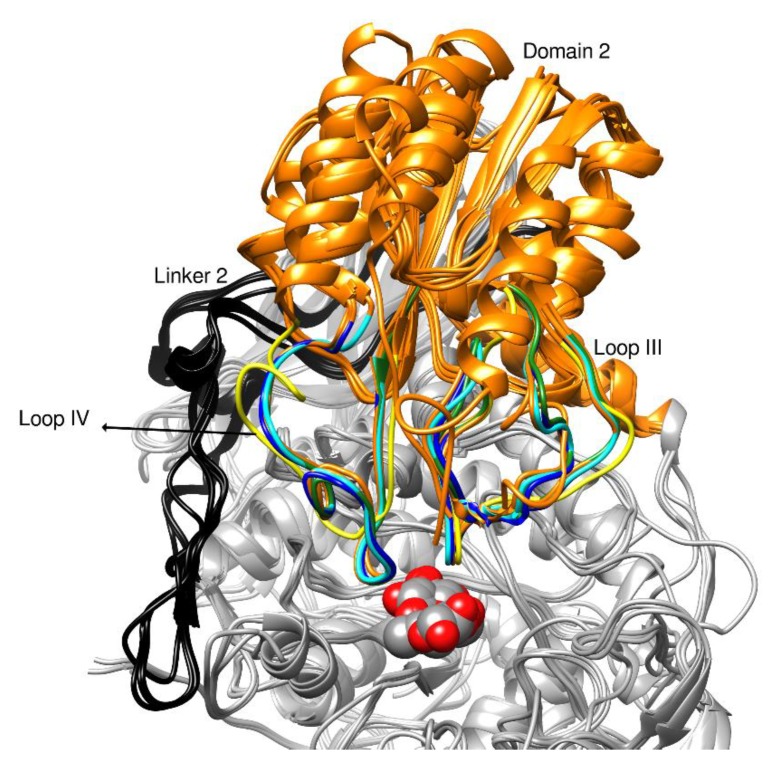
Figure 3.
Overview of domain 2 in ribbon representation CtBGL superimposed with the compared structures. Domain 2 is colored orange; loops III and IV in CtBGL, NcCel3A, ReCel3A, and TnBgl3B are colored in green, blue, cyan, and yellow, respectively, for structural comparisons. Linker 2 loop is colored in black, and the active site is depicted by the bound BGC in sphere representation.

