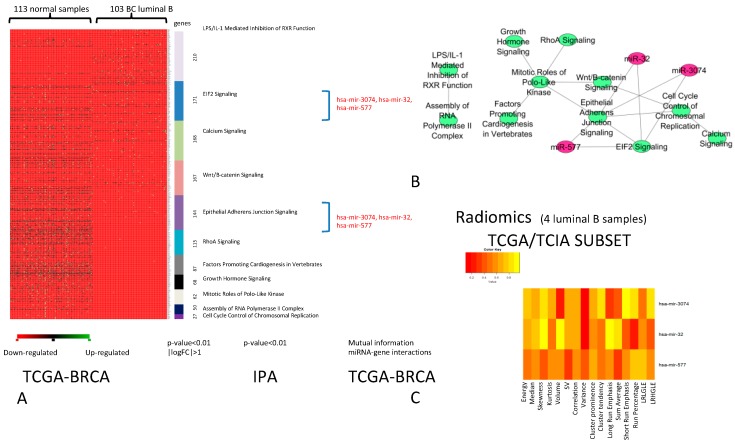
Figure 2.
BC Luminal B. (A) Pathways able to classify Luminal B vs. normal samples (p-value < 0.01, |logFC| > 1). For each pathway (in different colours), miRNAs (in red) able to regulate DEGs are indicated. (B) Relationships between pathways and miRNAs (green nodes are the pathways and purple nodes are the miRNAs). (C) Heatmap of the correlation between imaging features and miRNAs. The color intensity in the figure shows the corresponding p-value; yellow cells indicate greater statistical significance.

