Figure 6.
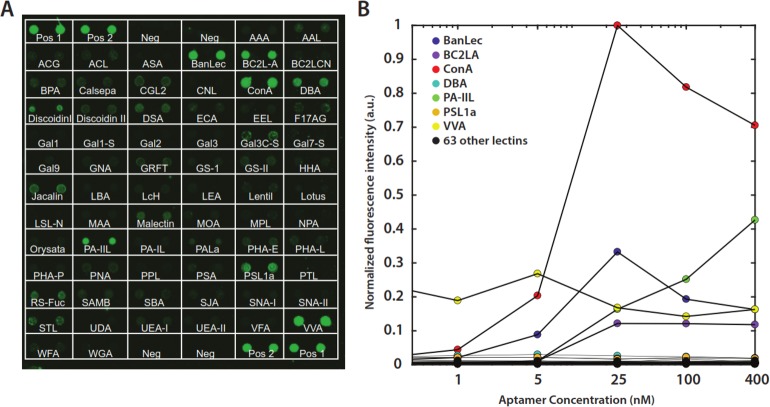
Lectin array demonstrates specificity of ConA-3-1m. (A) The strong specificity of ConA-3-1m is clearly apparent on an array of 70 lectins incubated with 100 nM aptamer. Each lectin is spotted in duplicate. The short names of the lectins are written under the spots (detailed information in Table S4); pos and neg denote positive and negative controls, respectively. (B) Quantitation of binding of ConA-3-1m to the array at lectin concentrations ranging from 40 pM to 400 nM. Data are normalized to the maximum fluorescence intensity of Con A. Positive and negative control array data were not included in the plot. The slightly lower fluorescence signal seen with Con A at the two highest concentrations was attributed to the self-quenching effect of the fluorophores at high local concentrations on the array surface.

