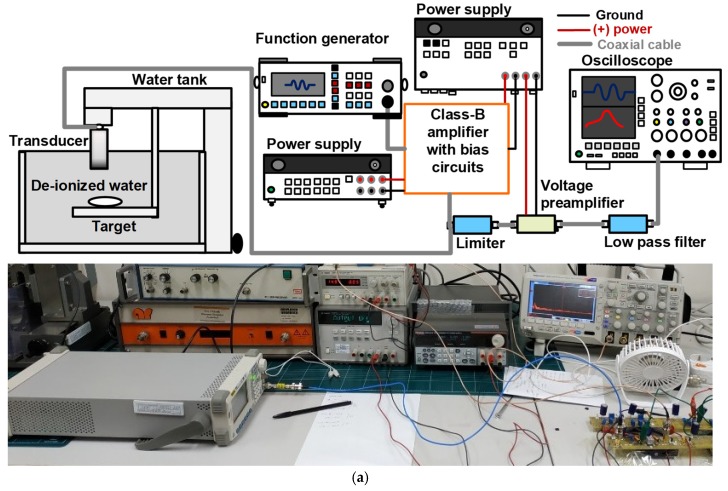
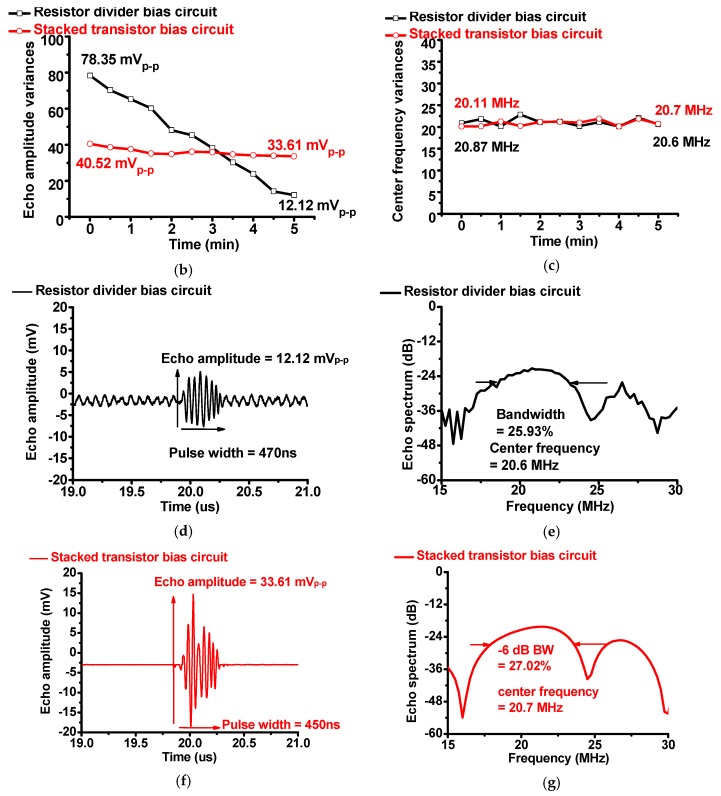
Figure 8.
(a) Measurement setup schematic diagram and picture of the pulse-echo response using the class-B amplifier with bias circuits; (b) echo amplitude and (c) spectrum variance when using the class-B amplifier with resistor divider and stacked transistor bias circuits; echo amplitude versus time when using class-B amplifiers with (d) resistor divider and (e) stacked transistor bias circuits; echo spectrum versus frequency when using class-B amplifiers with (f) resistor divider and (g) stacked transistor bias circuits.


