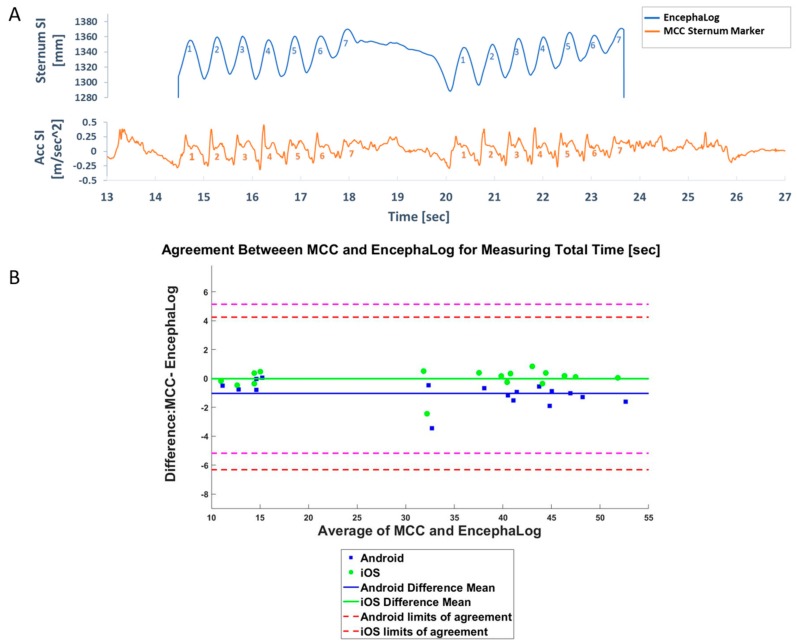
Figure 3.
MCC results. (A) Example of a visual comparison of MCC (top) and EncephaLog (bottom) signals. Note the similarity in the number and duration of steps during TUG Walk Away (WA) and Walk Back phases (WB), despite the different recourses: Superior-Inferior (SI) coordinates in 3D space in the MCC, and acceleration-SI in EncephaLog. (B) Bland–Altman plot, reflecting the degree of agreement between MCC and EncephaLog for TUG Completion Time (n = 17 samples). Presented here is data from an Android (blue) and iOS (green) devices. Dashed lines represent 95% confidence intervals of Bland–Altman (B&A) for Android (magenta) and iOS (red). Similar results and graphs were obtained for all biomarkers in this experiment.

