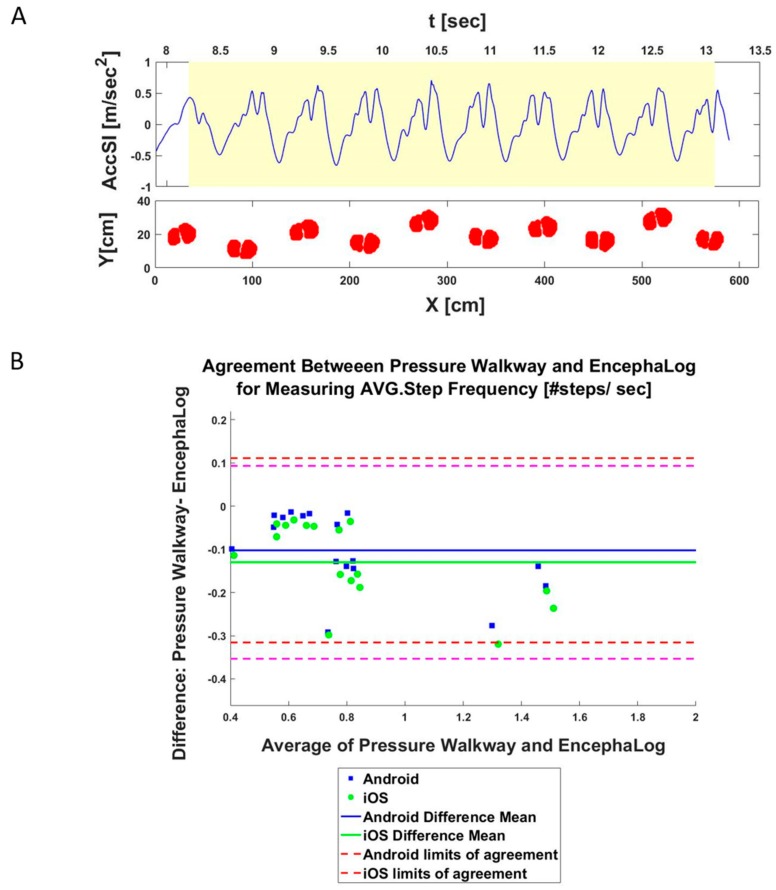
Figure 4.
Pressure mat results. (A) Example of a visual comparison of pressure mat (bottom) and EncephaLog signals (top). Note the similar walking patterns captured simultaneously by both methods. (B) B&A plot, an agreement measurement for Average Steps Frequency between pressure mat and EncephaLog (n = 15 samples), performed on Android (blue) and iOS (green) devices.

