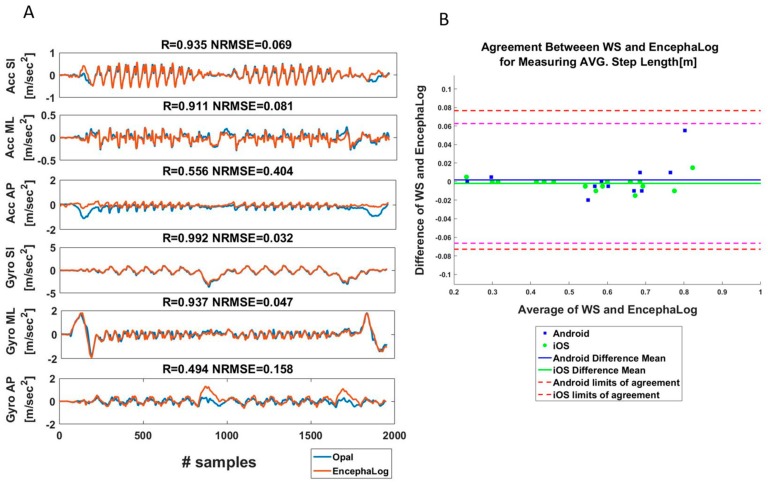
Figure 5.
Wearable sensor results. (A) Comparison between EncephaLog and Opal WS of linear and angular accelerations. Correlation coefficient (R) and Normalized Root Mean Square Error (NRMSE) between signals of the two methods are presented above each graph. (B) B&A plot, an agreement measurement of Average Step Length between Opal and EncephaLog (n = 15 samples) performed on Android (blue) and iOS (green) devices.

