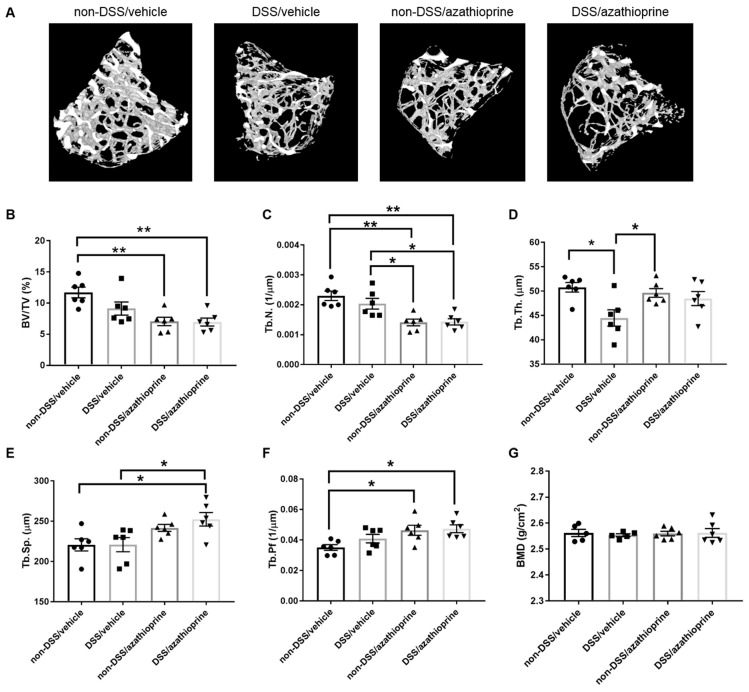
Figure 3.
Trabecular bone microarchitecture of azathioprine and vehicle treated mice treated with 3% DSS. (A) Representative 3D microCT reconstructions. Trabecular bone parameters between treated and control groups, (B) bone volume/tissue volume (BV/TV), (C) trabecular number (Tb. N.), (D) trabecular thickness (Tb. Th.), (E) trabecular separation (Tb. Sp.), (F) trabecular pattern factor (Tb. Pf.), (G) trabecular bone mineral density (BMD). Data are presented as mean ± S.D. (n = 6/group). * p < 0.05. ** p < 0.01.

