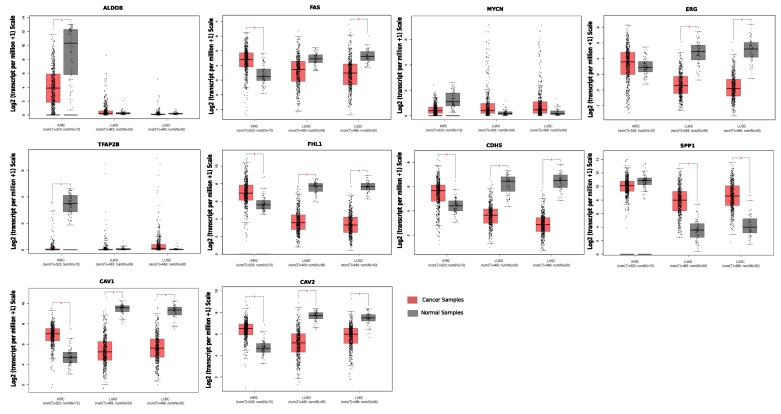
Figure 6.
The figure shows the results of differential expression analysis from TCGA data in the form of a box plot for ALDOB, MYCN, TFAP2B, FHL1, CDH5, SPP1, CAV1, CAV2, FAS, and ERG genes. In each figure, the comparison of normal (grey) versus cancer (red) tissue is shown among three different cancer types, i.e., lung adenocarcinoma (LUAD), lung squamous cell carcinoma (LUSC), and kidney renal clear cell carcinoma (KIRC).

