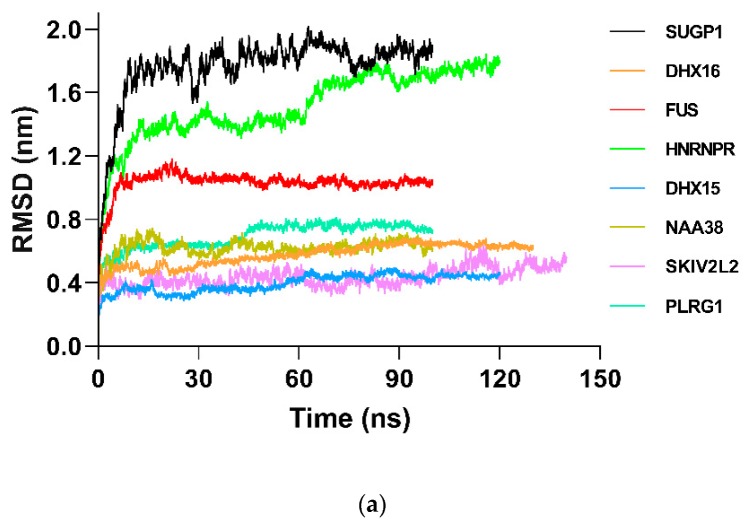
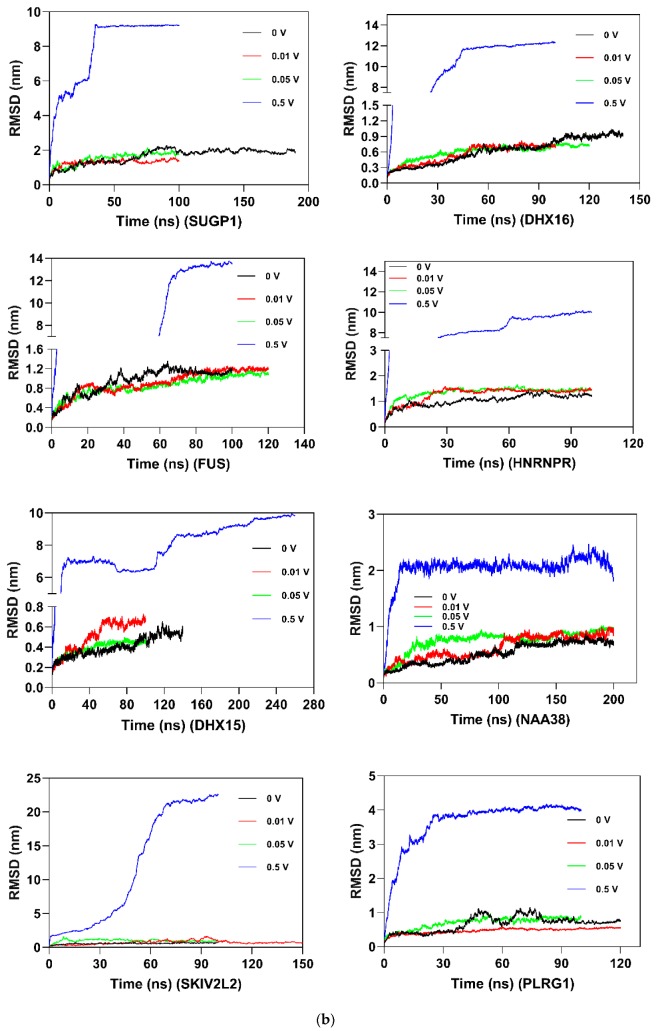
Figure 6.
Root mean square deviation (RMSD) comparison plots of backbone Cα atoms during molecular dynamics simulation (at least >100 ns). In order to show the deviations of hub proteins clearly, the RMSD plots are shown. (a) The RMSD of each hub protein under molecular dynamics (MD) of “protein in water”. (b) The RMSD of selected hub proteins under MD of “protein under nsPEFs”. For each protein, 0 V (black), 0.01 V (red), 0.05 V (green), and 0.5 V (blue) are displayed on one map.


