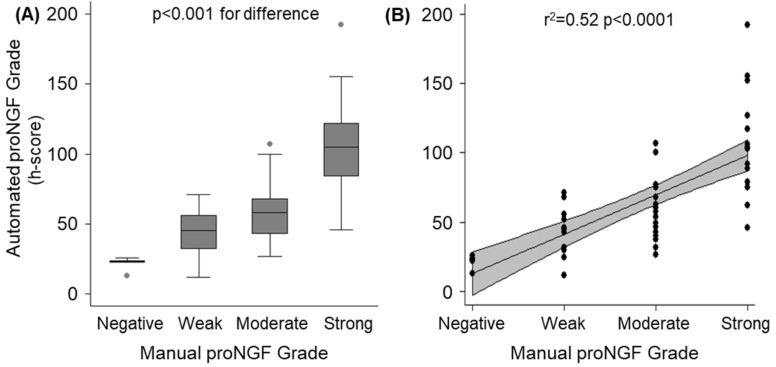
Figure 1.
Validation of automated immunohistochemistry analysis (h-scores) compared to manual grading for the cohort of 56 primary tumours. (A): Box and whisker plot demonstrating distribution of automated h-scores, stratified by manual scores. Significant between-group differences were confirmed by ANOVA (p < 0.001). (B): Scatter-plot of individual automated h-scores (dots) over manual grading. The solid line represents the regression fit, with the grey band demonstrating the 95% CI of the regression line (r2 = 0.52, p < 0.0001).

