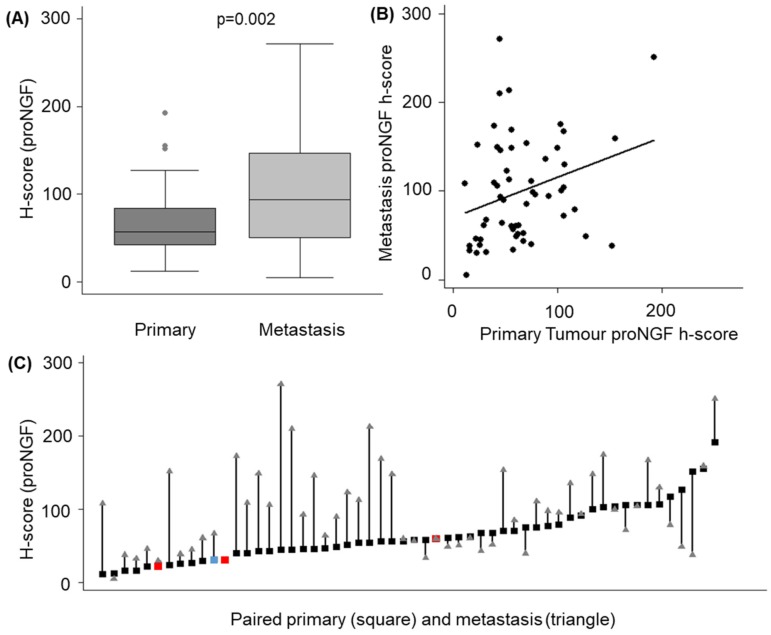
Figure 5.
Quantification of proNGF staining in primary thyroid tumours vs lymph node metastases. (A) H-score for proNGF intensity in primary tumours and linked metastases. (B) Scatter plot showing correlation between h-score in primary and paired metastases (C) Individual data points for the 56 paired cases of primary tumour (squares, PTC = black, FTC = red, ATC = blue) and nodal metastases (triangle).

