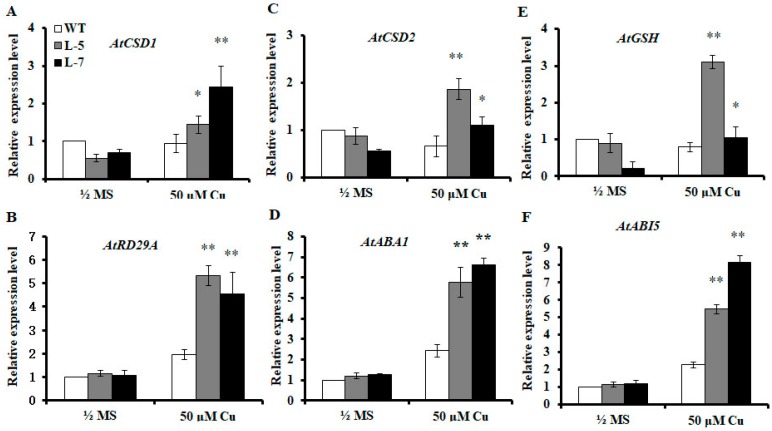
Figure 6.
Quantitative reverse transcription-polymerase reaction (qRT-PCR) gene analysis. qRT-PCR analysis of relative expression of (A) AtCSD1, (B) AtRD29A, (C) AtCSD2, (D) AtABA1, (E) AtGSH, (F) and AtABI5, in two-week-old transgenic and wild-type (WT) plants treated with (Cu) or without (Control) 50 μM copper chloride (CuCl2) for 24 h. Values are means ± standard deviation (SD) of three independent biological replicates; * p < 0.05 and ** p < 0.01 indicate significant differences from wild-type plants under the same conditions, determined using the Student’s t-test.

