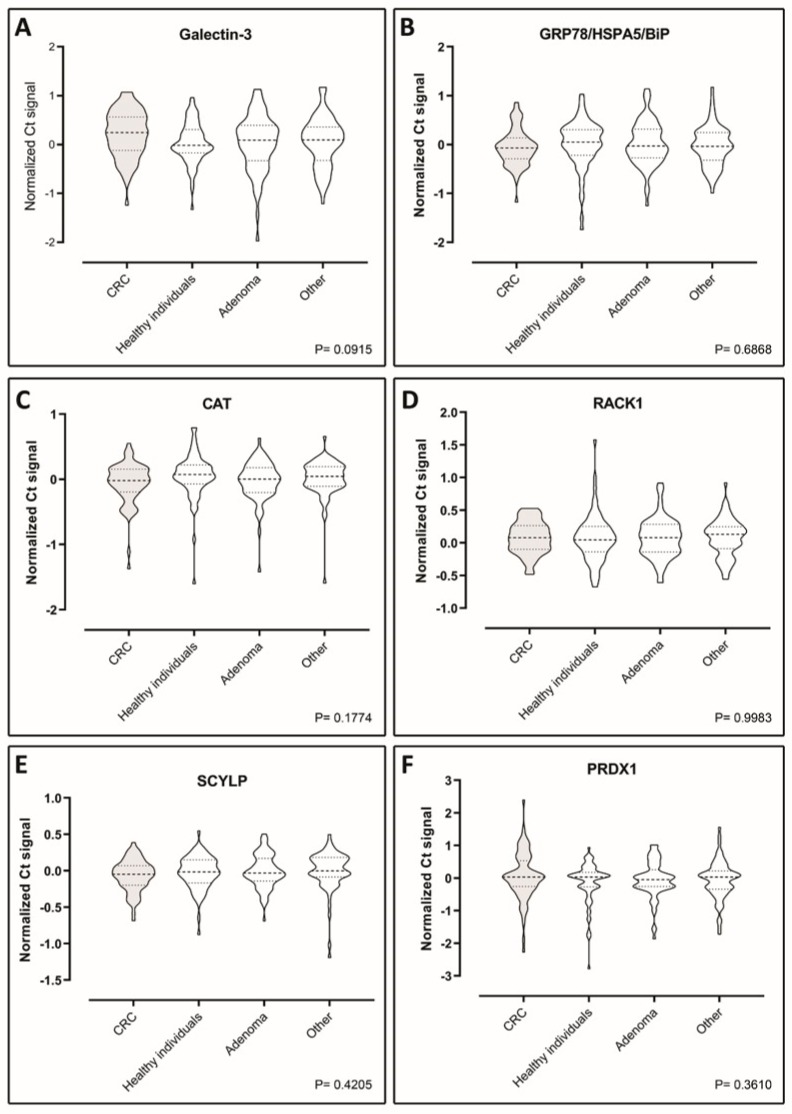
Figure 3.
Violin plots showing comparisons of the plasma levels of six biomarkers—(A) galectin-3, (B) Grp78, (C) Cat, (D) Rack1, (E) Scylp, and (F) Prdx1—between CRC patients, healthy individuals, adenoma patients, and patients with diseases other than cancer (70 case-control sample set). Data are presented as Ct normalized signals measured for each protein in all four groups. The p-values were determined using ANOVA statistical tests. Mean values are indicated by horizontal bars. CRC sample plots are grey-shaded, all others are white.

