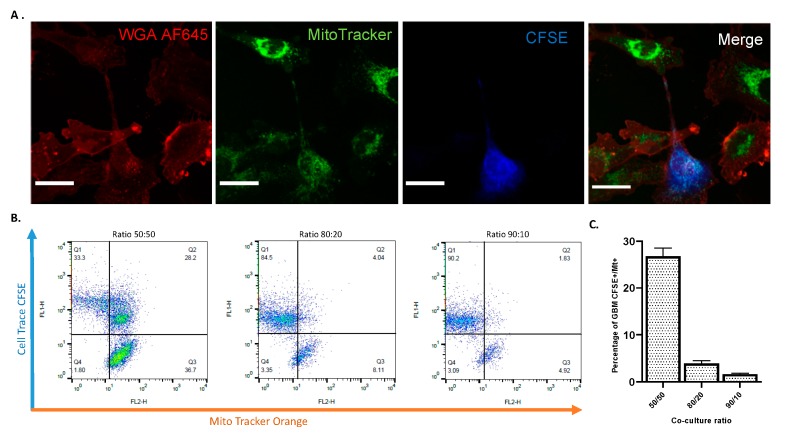
Figure 10.
Mitochondrial transfer via nano tunneling from astrocytes to CFSE-positive GBM cells. (A) Confocal images of mitochondrial transfer through TNTs. Astrocytes (UP-010) were stained with Mito Tracker Orange (25 nM) to follow their mitochondria. Subsequently, they were co-cultured with GBM cells (UP-007) stained with CFSE. Prior to confocal imaging, co-cultures were stained with WGA AF594 to reveal cell membranes and TNT connections. Confocal microscopy showed Mito-Tracker Orange FM signal transferring from astrocytes to GBM cells through TNTs (white arrow) while a green dot can be seen in the recipient GBM cell (left-up panel, green arrows), and a considerable amount of Mito Tracker green signal dots could be seen in the plasma of GBM cells tracked by Cell Trace-CFSE. Scale bar: 50 µm. (B) Flow cytometry plot of different ratio of co-culture of GBM CFSE+ and astrocytes positive for Mito Tracker Orange. Prior to co-culture astrocytes were stained with Mito Tracker Orange FM. The number of GBM cells taking up mitochondria from astrocytes increased in relation to the number of astrocytes positive for Mito Tracker. (C). Plot representations of the flow cytometry findings. Mean ± SEM (n = 3).

