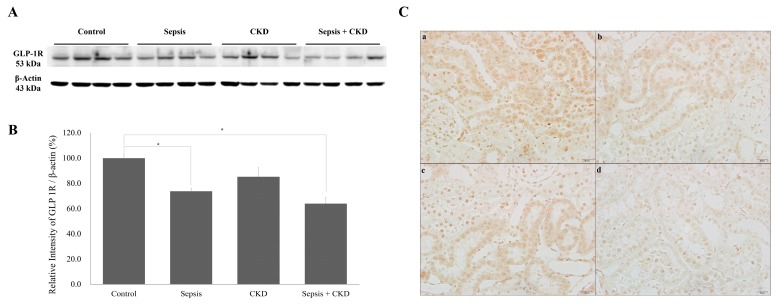
Figure 5.
Renal GLP-1R expression in sepsis, CKD, and CKD-with-sepsis. (A) Western blots showing GLP-1R expression in the renal cortex. (B) Quantification of GLP-1R was standardized based on β-actin expression in the renal cortex. (C) Immunohistochemistry of renal GLP-1R (×400). Control, sham-operated; sepsis, cecal ligation, and punctured (CLP) rats; values are presented as the mean ± standard deviation (SD). * p < 0.05 vs. control.

