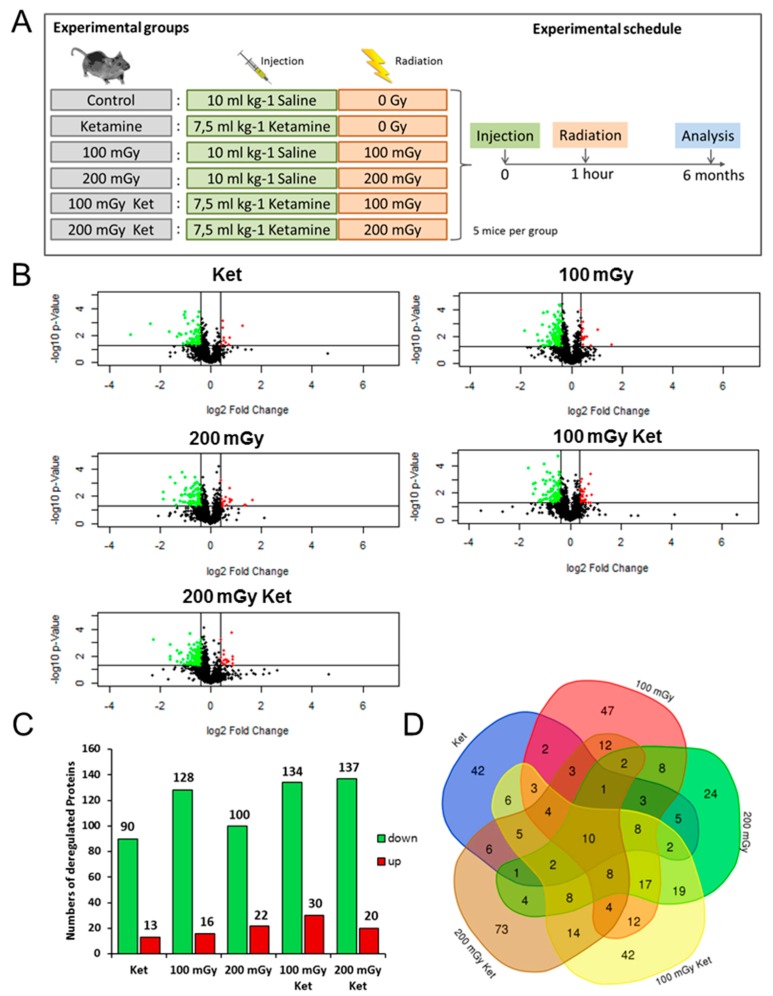
Figure 1.
Changes in the hippocampal proteome after single treatment or co-treatment. (A) Schematic presentation of the experimental groups and the treatment schedule. (B) Volcano plots representing the distribution of all quantified proteins (identification with at least two UP) in hippocampi exposed to single treatment with ketamine (Ket), gamma radiation (100 mGy, 200 mGy), or combined treatment (100 mGy Ket, 200 mGy Ket). Deregulated proteins (p ≤ 0.05, fold-change ±1.3) are highlighted in green (downregulated) and red (upregulated). (C) Total numbers of significantly downregulated (green) and upregulated (red) proteins are shown for all treatments (p ≤ 0.05, fold-change ±1.3). (D) Venn diagram illustrating the number of shared deregulated proteins between the five experimental groups.

