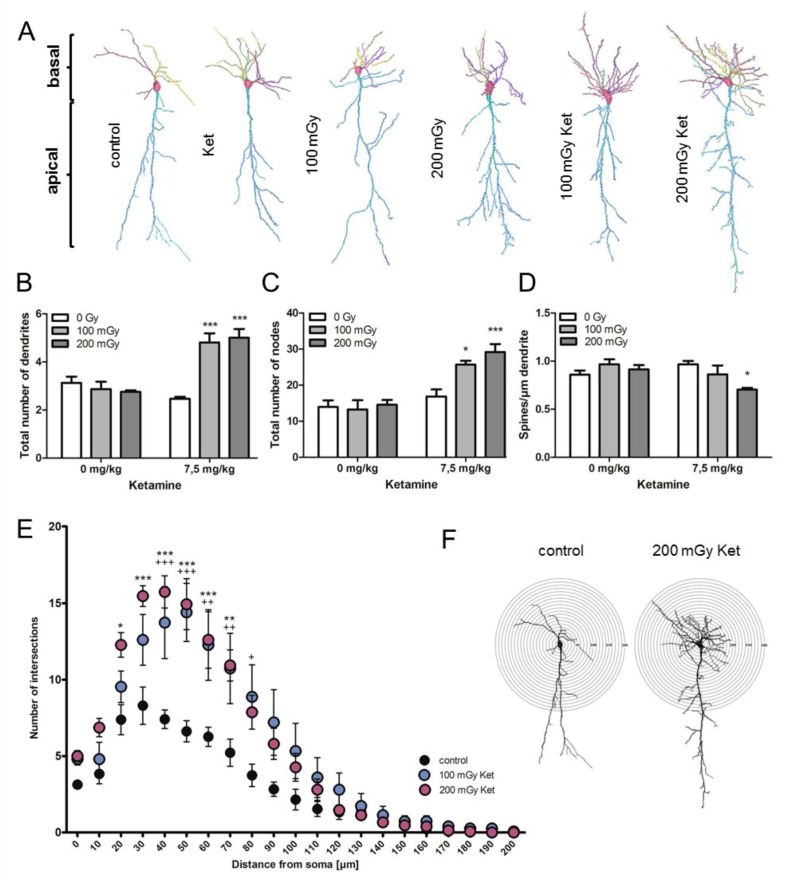
Figure 3.
Co-treatment with ketamine and irradiation led to structural changes in hippocampal CA1 neurons. (A) Reconstructed hippocampal CA1 neurons representative for each experimental treatment group are shown. Each individual dendrite is presented in a different color. (B) The number of basal dendrites is shown in all experimental groups. Five neurons per animal with 5 biological replicates were analyzed; *** p < 0.001. (C) The number of nodes representing the branching points in basal dendrites is shown. Five neurons per animal with 5 biological replicates were analyzed; * p < 0.05, *** p < 0.001. (D) The spine densities of the basal dendrites are shown. Five neurons per animal with 5 biological replicates were analyzed; * p < 0.05. (E) A comparison between the total number of dendritic intersections for each circle between the controls (black) and the co-treated neurons (100 mGy Ket: blue; 200 mGy Ket: purple) was performed. The co-treated animals showed significant increase in the number of intersections between 40 and 80 µm (100 mGy ket; + p < 0.05, ++ p < 0.01, +++ p < 0.01) and between 20 and 70 µm (200 mGy Ket; * p < 0.05, ** p < 0.01, *** p < 0.001). At least 5 neurons per animal with 5 biological replicates were analyzed. The first values (2 µm circle) represent the total number of basal dendrites, as shown in (B). (F) Representative CA1 neurons with concentric circles used for the Sholl analysis are shown. The radius interval between the circles was set to 10 µm per step, ranging from 10 to 200 µm from the center of the neuronal soma to the end of the dendrites. The numbers of dendritic intersections per circle were quantified. At least 5 neurons were analyzed per animal. The p values were calculated using a two-way ANOVA with Bonferroni multiple testing.

