Figure 3.
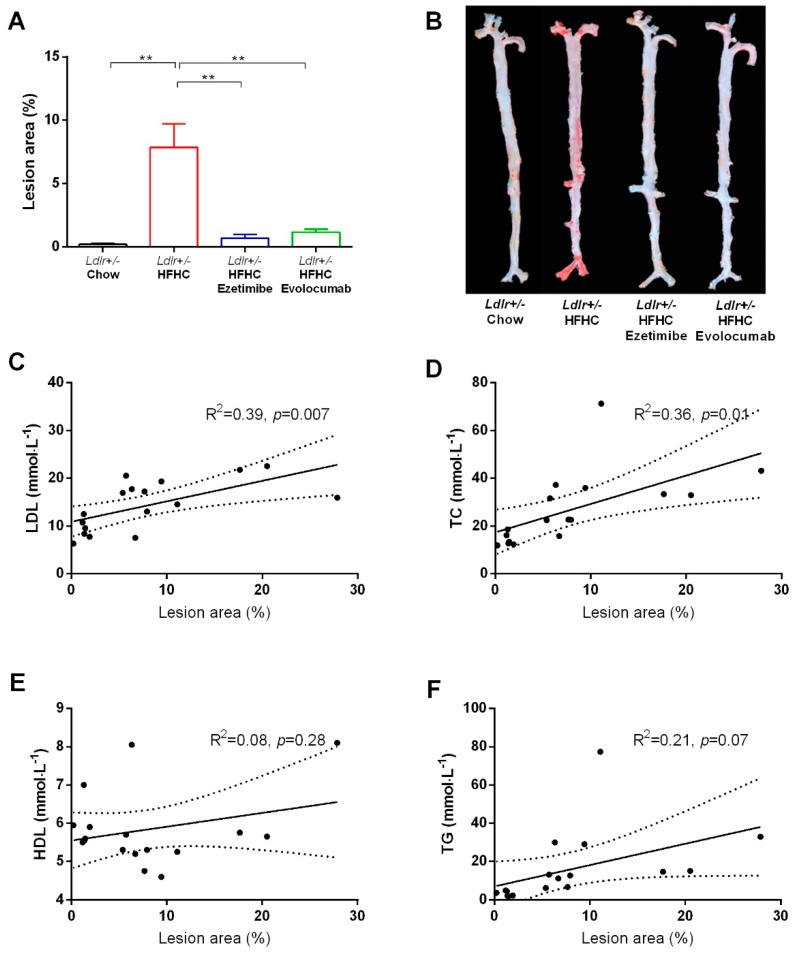
En face analysis of aortic lesion area and its correlation with plasma lipid profiles. (A) Quantitative analysis of whole aorta lesion area. ** p < 0.01 compared with values in the HFHC diet model group. One-way ANOVA with Dunnett’s multiple comparisons test was performed. (B) Representative images of en face analysis. (C–F) Correlations between lesion areas and plasma LDL-C, TC, HDL, and TG in the HFHC diet model group were analyzed by linear regression. Dashed line shows 95% confidence band of best fit line.

