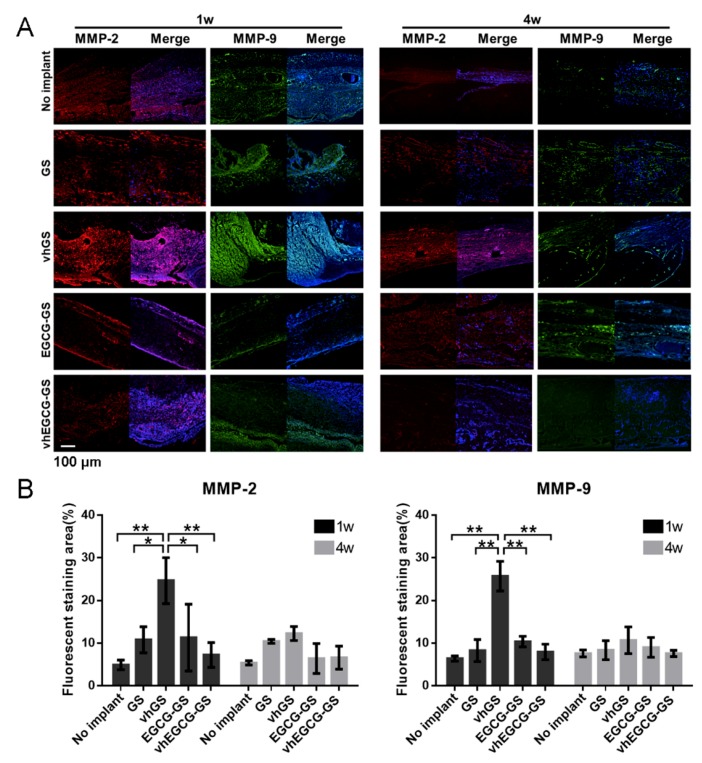
Figure 6.
MMP-2 and -9 expression in the defects. (A) Immunohistochemical staining of defects treated with or without sponges for 1 or 4 weeks. Red: MMP-2; green: MMP-9; blue: DAPI; Purple: merge of MMP-2 and DAPI; light blue: merge of MMP-9 and DAPI. (B) Fluorescently stained area of MMP-2 or -9. Data are means and SDs. * p < 0.05, ** p < 0.01 (n = 3, ANOVA with Tukey-Kramer tests).

