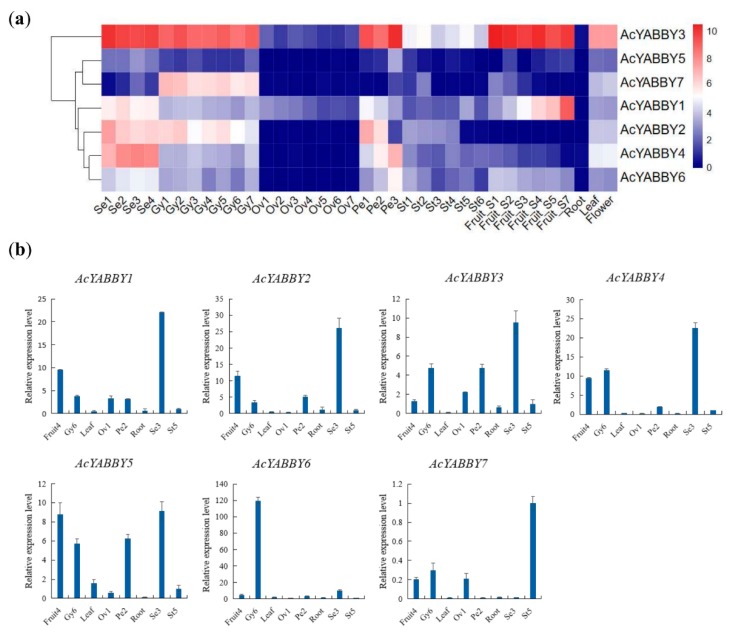
Figure 5.
Expression profiles of the pineapple YABBY genes. (a) Heat-map of AcYABBY genes expression profiles in different tissue generated from RNA-seq data. The AcYABBYs were clustered according to their expression patterns. Red color indicates high levels of transcript abundance and blue indicates low transcript abundance. The color scale is shown on the right. Samples are mentioned at the bottom of each lane: Se (sepal) Se1-Se4, Gy (gynoecium) Gy1-7 Ov (ovule) Ov1-Ov7, Pe (petal) Pe1-Pe3, St (stamen) St1-St5, Fruit S1-S7, Root, Leaf, Flower. (b) Expression analysis of 7 pineapple YABBY genes in eight representative samples by RT-qPCR. RT-qPCR data were normalized using pineapple PP2A gene and vertical bars indicate standard deviation.

