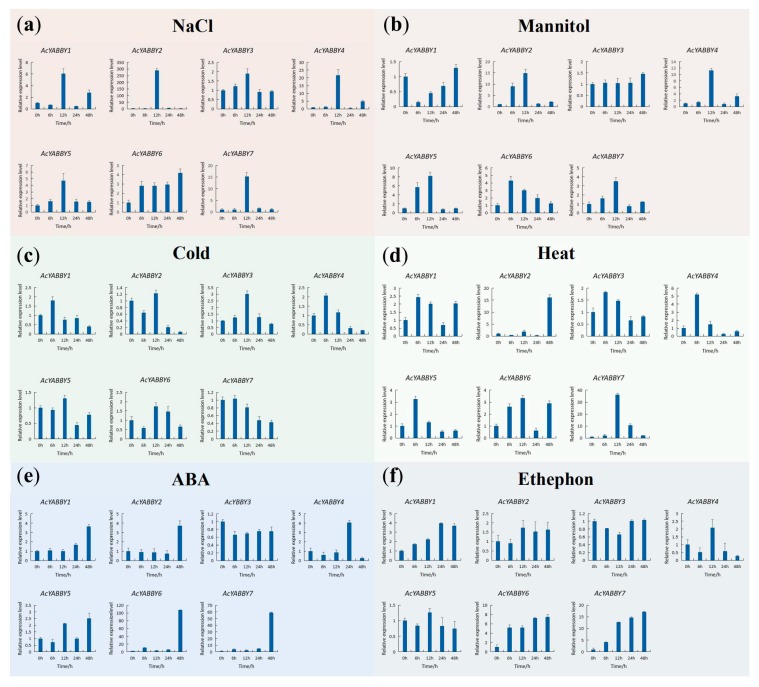
Figure 7.
Expression profiles of 7 selected AcYABBY genes in response to various abiotic stress treatments. (a) NaCl treatment. (b) Mannitol treatment. (c) Cold treatment. (d) Heat treatment. (e) ABA treatment. (f) Ethephon treatment. RT-qPCR data were normalized using pineapple PP2A gene as reference gene. Error bars indicate Standard Deviation.

