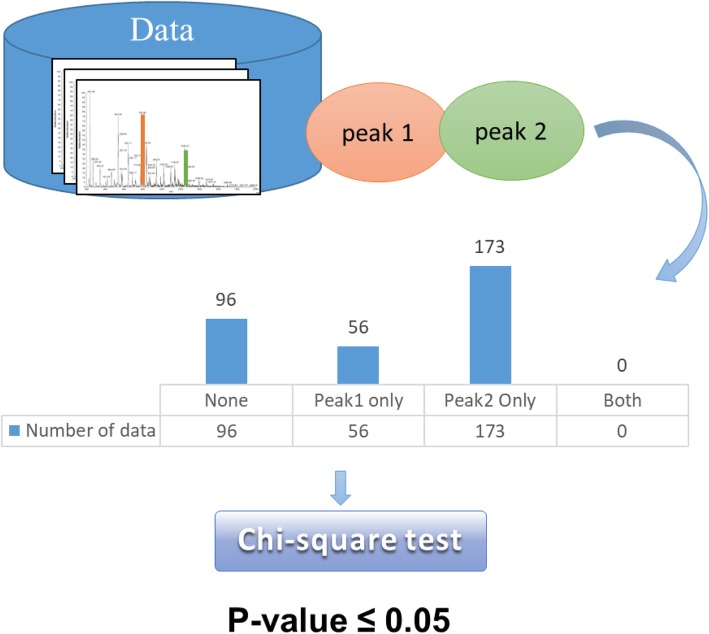
Fig. 8.
Data distribution of discriminative peak pairs for each serotype. The peaks were selected and ranked by PCC. a Type Ia, (b) Type Ib, (c) Type III, (d) Type V, and (e) Type VI. The distribution of data for each pair of the training data set in each model is shown. The term ‘none’ in the legend indicates that both peaks are absent. The terms ‘peak1’ and ‘peak2’ represented that only the peak above VS appeared or the lower peak appeared. The term ‘both’ represented the simultaneous appearance of two peaks. Overall, there was a significant difference of each pair based on different combinations in the positive and negative data set

