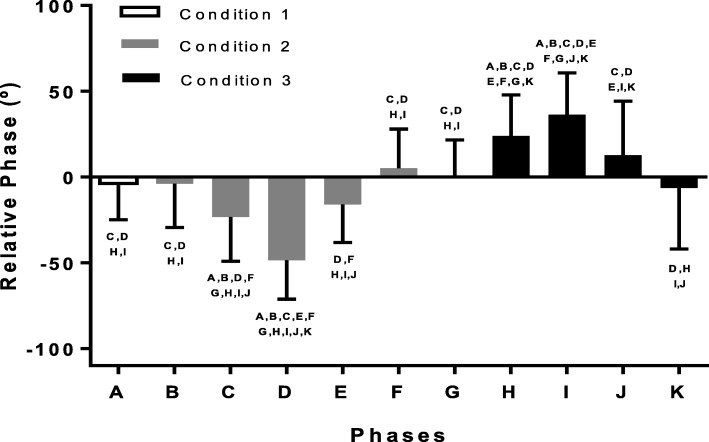
Fig. 4.
mean and standard deviation of the relative phase (expressed in degrees) in the eleven phases (A to K, as defined in Fig. 1) of the three experimental conditions (condition 1 in white, condition 2 in gray and condition 3 in black). Letters on top of the standard deviation indicate statistical differences from the referenced phase (p < 0.05)

