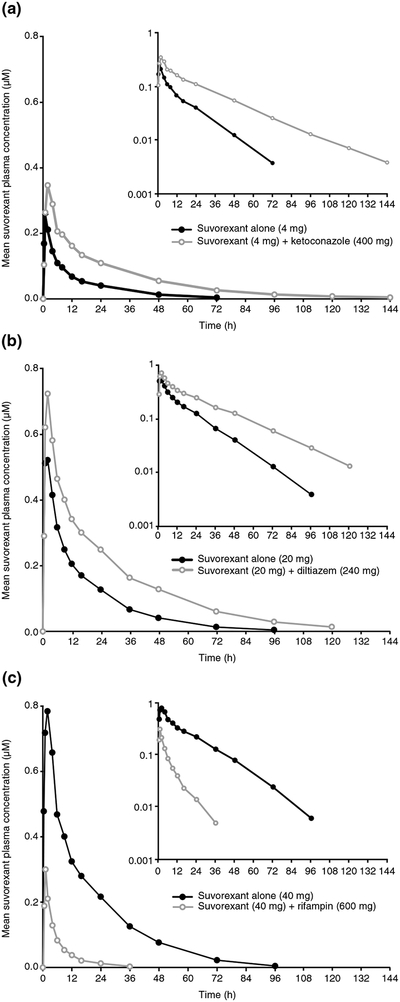
Fig. 2.

Arithmetic mean plasma concentration–time profile of suvorexant following administration of suvorexant alone or co-administered with a the strong CYP3A inhibitor ketoconazole (N = 10, Study P008), b the moderate CYP3A inhibitor diltiazem (suvorexant alone, N = 20; suvorexant plus diltiazem, N = 18; Study P038), or c the strong CYP3A inducer rifampin (N = 10, Study P038), in healthy subjects. Inset: semilog scale. CYP cytochrome P450, h hours
