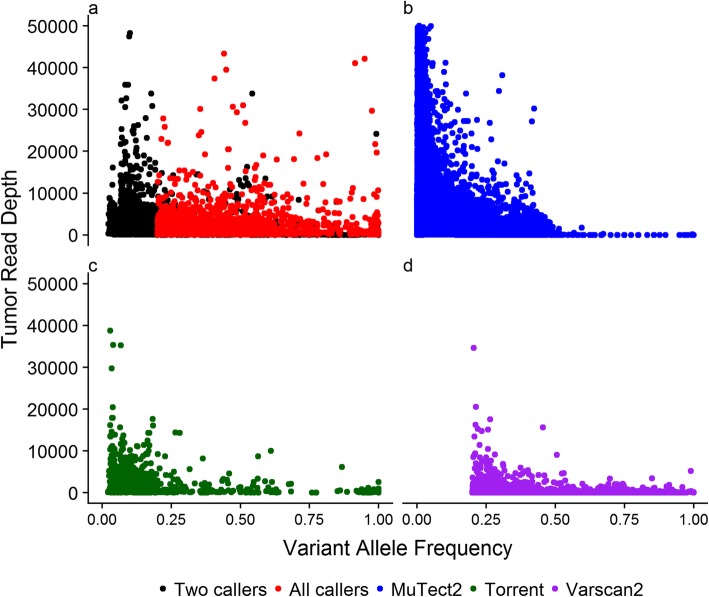
Fig. 2.
Comparison between SNVs identified by the three somatic variant callers. The Y-axis of each scatter plot indicates the read depth of SNVs in tumour tissue sample, the X-axis shows the VAF of each SNV. The dots represent SNVs from tumour-blood pairs. The colour indicates the variant calling method. a All callers: SNVs identified by all three callers; Two callers: SNVs identified by any two of the three callers. b MuTect2: SNVs uniquely identified by MuTect2. c Torrent: SNVs uniquely identified by TVC. d VarScan2: SNVs uniquely identified by VarScan2

