Fig. 2.
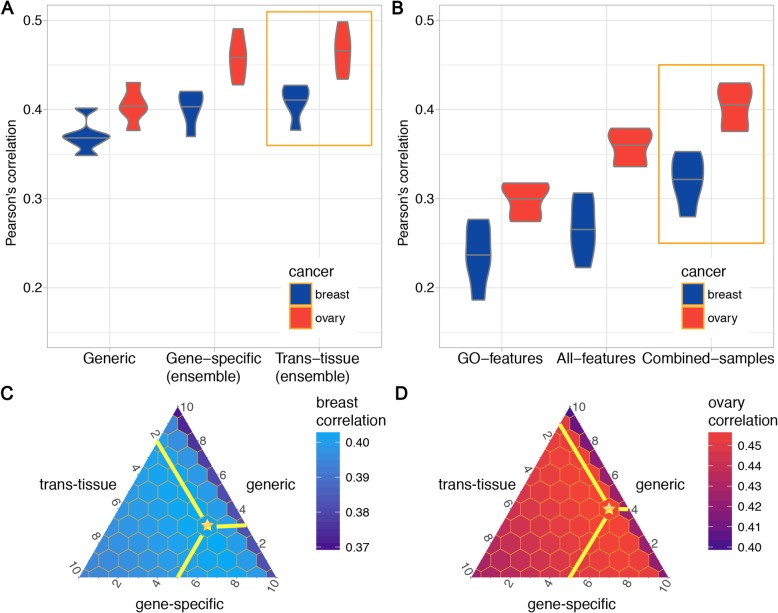
The contributions of different models to proteome prediction in breast and ovarian cancers. a From left to right, the correlations were calculated by assembling the following three models step by step (blue: breast; red: ovary): (1) The generic model, which only uses the transcript-level expression of a target protein as the only feature; (2) the gene-specific model, which uses the transcript-level expressions of all genes as features for predicting a target protein; and (3) the trans-tissue model, which is similar to the gene-specific model yet combines both breast and ovarian cancer samples. b Dissection of the gene-specific model by using different sets of features and samples. (1) Sub-selecting all genes related to “gene expression” as features. (2) Using all transcripts as features to predict the target protein. (3) Combining samples from two tissues to train. The correlations between all pairs of models are significantly different (p < 2.2e−16) using Wilcoxon signed-rank test, after bootstrap sampling for 1000 times. c, d. The contributions of the generic, gene-specific, and trans-tissue models to the final predictions in the c breast and d ovary. Each grid within a triangle represents the combination of three models, and the distances to three edges correspond to three weights. If a grid is far away from an edge, it means the corresponding model has a large weight. The combination that achieves the highest correlation is labeled by the golden star, where the best combination weights of the generic, gene-specific, and trans-tissue models are 2:3:5 in the breast and 1:4:5 in the ovary. Notably, the right arms of both triangles are in “darker” color (lower correlations), representing large correlation increases when the generic model are integrated

