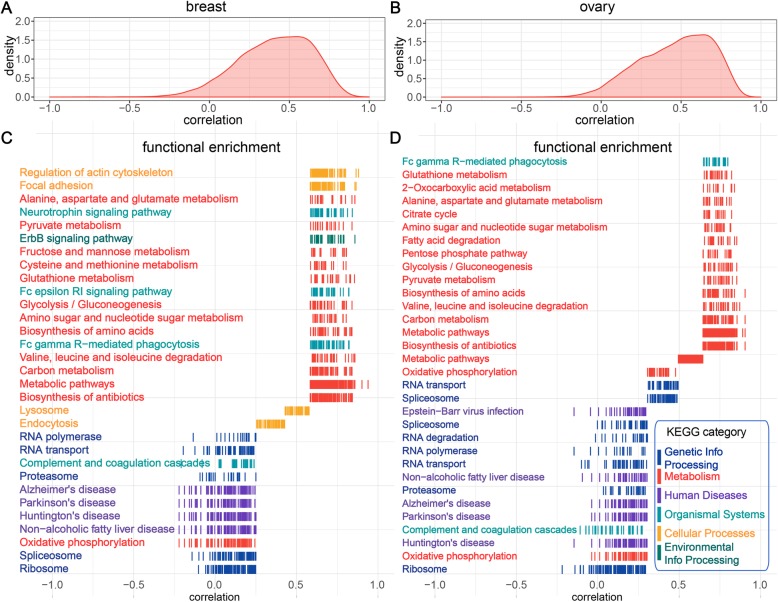
Fig. 4.
The functional enrichment analysis of gene sets with different predictability spectrums. a, b The overall distribution of Pearson’s correlations between observations and our predictions in a breast and b ovarian cancers. c, d Functional enrichment analysis was performed on gene subsets based on the predictability. The colors represent the major KEGG categories. Genes with high prediction correlations are mainly associated with “Metabolism,” whereas genes with low prediction correlations are mainly associated with “Genetic Information Processing” and “Human Diseases”

