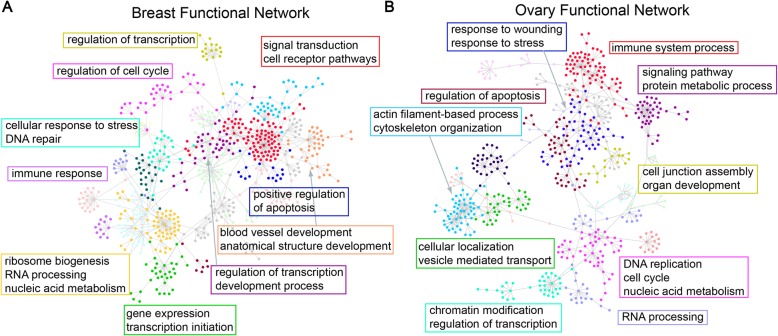
Fig. 6.
Functional clusters in the gene-gene interaction network that drive the regulation of protein abundance. a, b Decomposition of gene functional network among “driver” genes in breast (a) and ovarian (b) cancers reported important metabolism pathways. The gene clusters were shown in different colors and visualized using a gene-gene interaction network. The shared biological processes of selected clusters were labeled in rectangles

