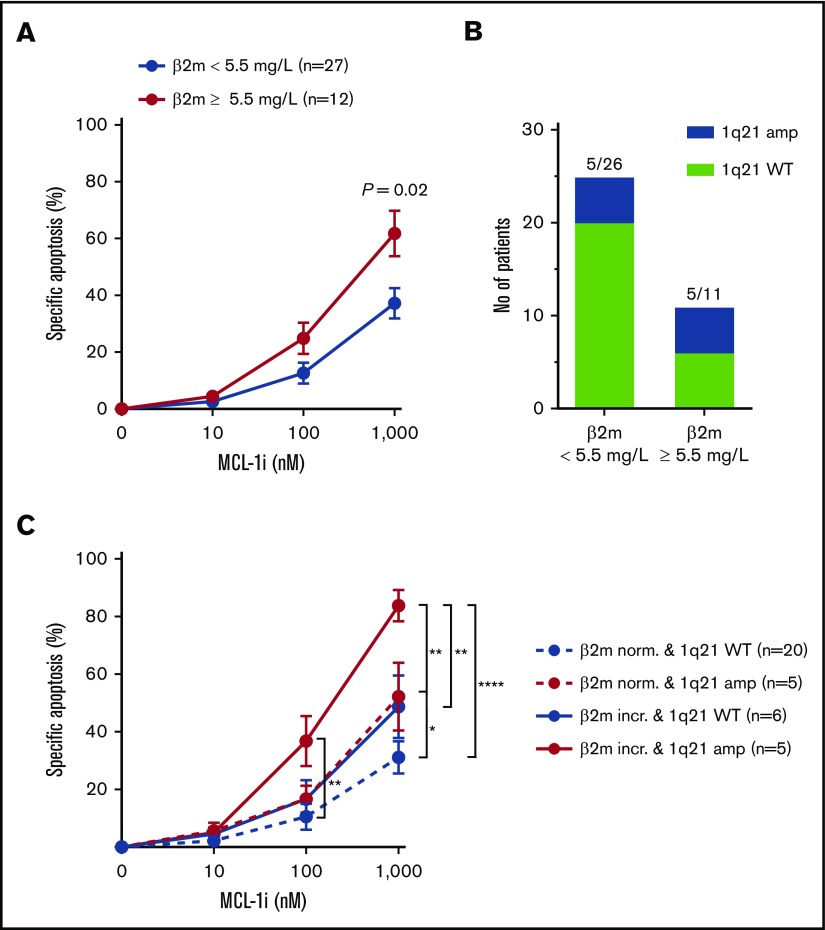
Figure 6.
Presence of 1q21 in combination with other poor-prognosis diagnostic markers identifies patient subsets of MM most sensitive to MCL-1i. (A) Specific apoptosis of patients with normal (<5.5 mg/L; n = 23) or increased (≥5.5 mg/L; n = 15) serum β2m levels, after treatment with MCL-1i for 24 hours. (B) Fraction of patients with 1q21 amplification in the groups shown in panel A. (C) As in panel A, but with stratification for 1q21 amplification status. Red lines indicate patient groups with 1q21 amplification, and blue lines show groups with WT 1q21. Dotted lines indicate normal levels of β2m, and filled lines indicate increased β2m. Group sizes are shown in the figure legend. *P < .05, **P < .01, ****P < .0001.

