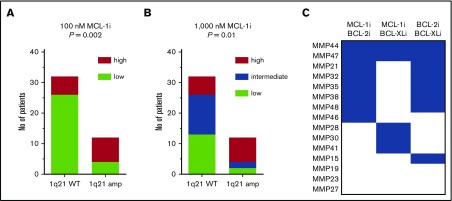
Figure 7.
A subset of patients without 1q21 amplification shows sensitivity to MCL-1 inhibition. (A) Fraction of patients within 1q21 WT and amplified groups with high (≥20%; n = 14) or low (<20%; n = 30) sensitivity to MCL-1i at 100 nM. Significance by χ2 test is shown in the graph. (B) As in panel A, but at 1000 nM of MCL-1, where high (≥60%; n = 14), intermediate (23%-60%; n = 15), and low (<23%; n = 15) sensitivity groups could be identified. Cutoff values were based on terciles of specific apoptosis after 24 hours of treatment with MCL-1i. (C) Inhibitor combination sensitivity of patients with low sensitivity to single MCL-1i. Blue boxes indicate at least intermediate sensitivity, after 24 hours of treatment with indicated inhibitor combinations (all at 100 nM). Two patients in this analysis had amplification of 1q21, namely MMP27 and MMP44.

