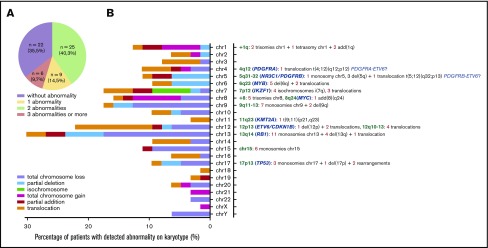
Figure 4.
Chromosomal abnormalities evidenced by conventional cytogenetic analysis in 62 cases. (A) Distribution of karyotype results. (B) Percentage and type of abnormality for each chromosome depicted on the left. Chromosomal abnormalities of particular interest are listed on the right, with loci concerned (green), candidate genes already described (blue), and number of patients (red) for each type of abnormality (gray) (ie, monosomies, trisomies, deletions, isochromosome, addition, and translocations). add, addition; chr, chromosome; del, deletion.

