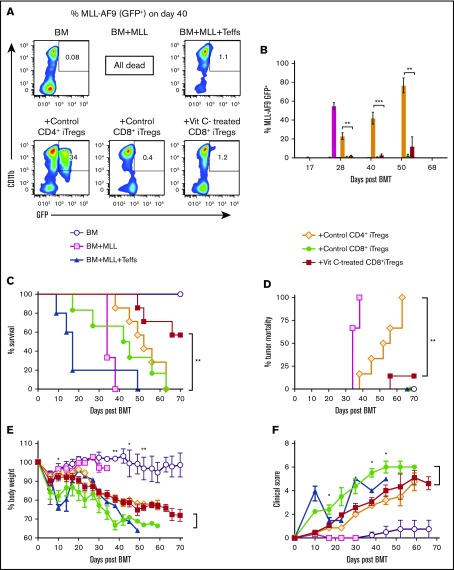
Figure 6.
Vit C–treated CD8+ iTregs alleviate GVHD without impairing the GVL effect in MLL model. Lethally irradiated BALB/c mice were adoptively transferred with 1 × 10⁶ CD8+ iTregs, 5 × 10⁶ WT TCD-BM cells, and 1 × 10⁵ MLL-AF9 cells. Three days later, 0.7 × 10⁶ CD25-depleted T cells were injected IV to induce aGVHD. (A) Representative FACS plots of MLL-AF9 (CD11b+GFP+) cells in recipient peripheral blood on day 40 post-BMT. (B) Bar graph shows the percentage of MLL-AF9 cells in the blood, quantified by GFP expression, at the indicated time points. Survival rate (C), tumor mortality (D), body weight loss (E), and clinical scores (F) of recipient mice were monitored until day 70 (n = 6 or 7 per group). The log-rank (Mantel-Cox) test was used for statistical analysis of the survival and tumor mortality data. One-way ANOVA was used for statistical analyses of MLL percentages, and the Student t test was used for body weight loss and GVHD clinical scores. *P ≤ .05, **P ≤ .01, ***P ≤ .0001.

